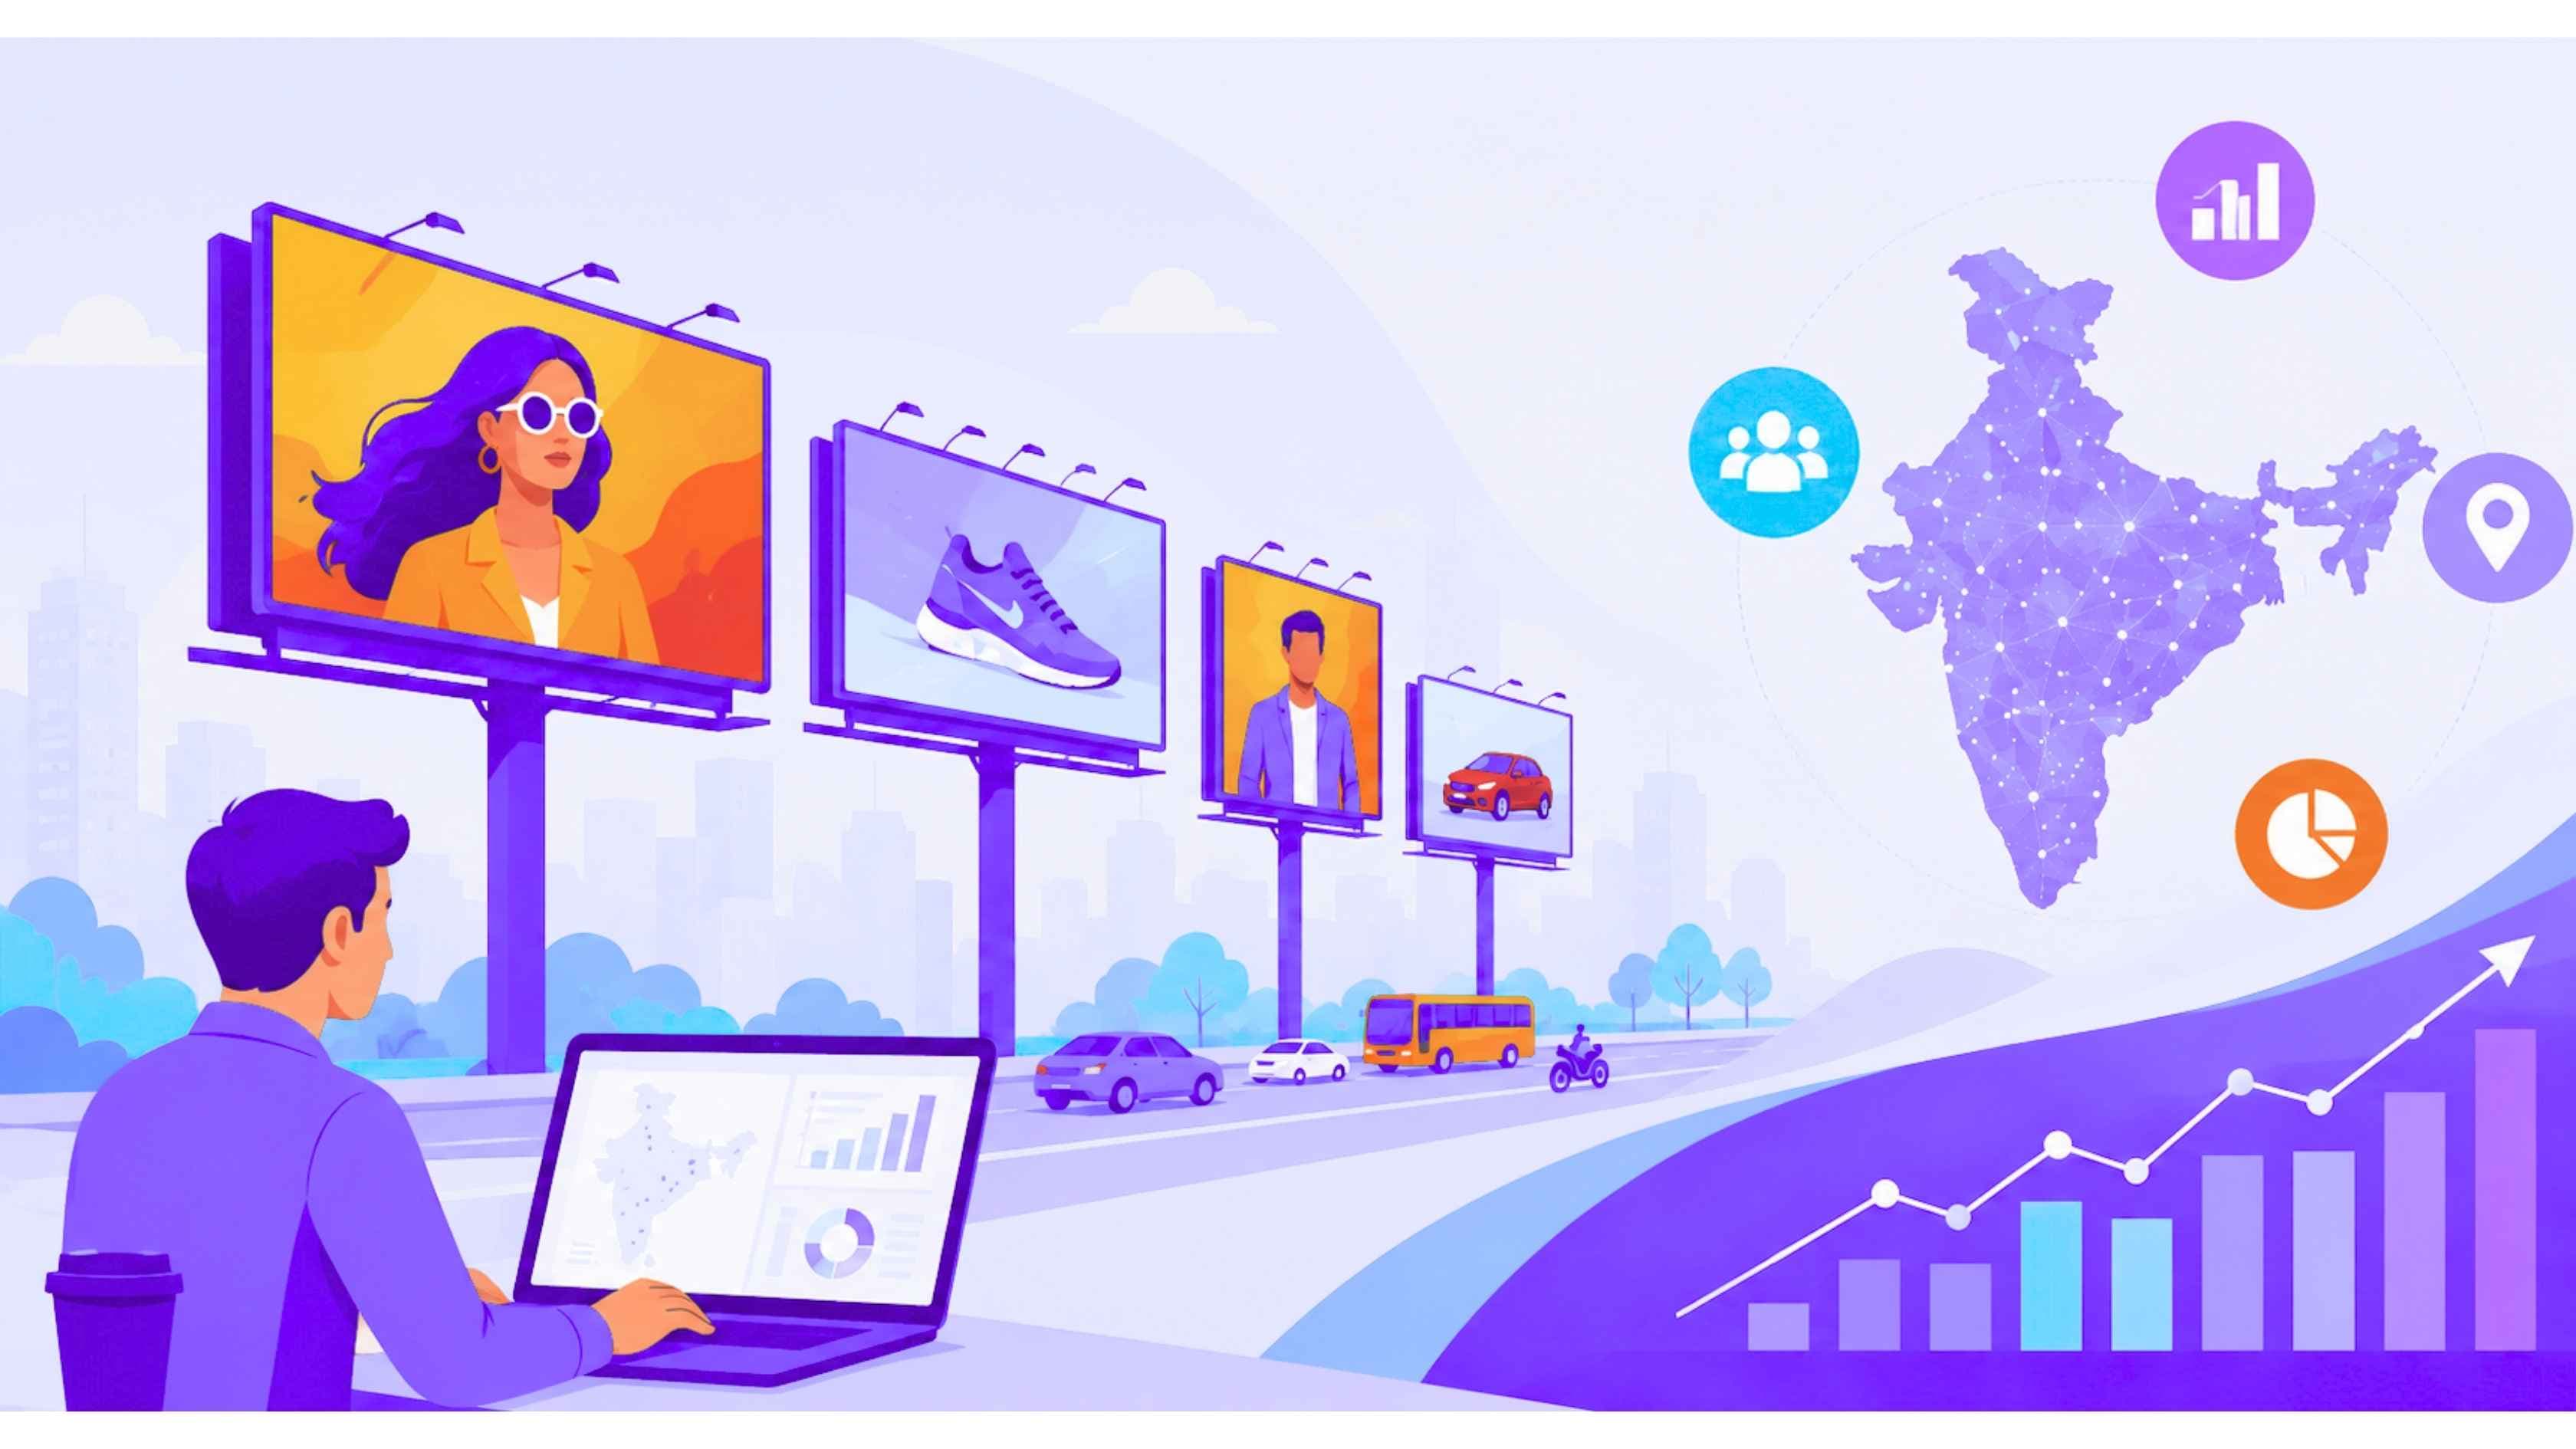
Know Who Walks Through the Gate, Not Just Who Buys A Ticket

MapZot.AI turns footfall in movie theatres, theme parks, stadiums, and event venues into decisions, where to open your next screen, how much a concert weekend is really worth to the block around it, and which zone of your park nobody is visiting

Get a Free Demo
0+
Entertainment venues mapped
0+
Cities with theatre & stadium coverage
0+
Million monthly visits tracked
0+
Minute footfall refresh rate
Entertainment banner

Box office numbers tell you what sold. They don't tell you who almost walked in and didn't

Ticketing systems, POS data, and app analytics only see the visitor after they've paid. Everything before that moment, the multiplex someone drove past, the theme park they compared you to, the stadium crowd that skipped your F&B counter, is invisible without location intelligence.

// blind spot 01

NO VISIBILITY OUTSIDE YOUR WALLS

You know your admits. You don't know your true catchment, how far people travel, or which pincodes never show up despite being 20 minutes away.

// blind spot 02

SITE DECISIONS MADE ON GUT FEEL

New screen, new park zone, new arena — launched on rent and footfall guesses from a broker, not on actual foot traffic data in theatres and competing venues nearby.

// blind spot 03

EVENT-DAY CROWDS, UNMEASURED

A concert or IPL match moves thousands of people, but most venues can't answer where they came from, how long they stayed, or what they did after leaving.

One venue traffic analytics platform, tuned for how each format actually works

MapZot.AI's cinema location intelligence platform extends across the full entertainment map, from a single-screen multiplex to a 100-acre theme park, with visitor behaviour analytics designed around each venue's real footfall patterns.

Movie Theatres & Multiplexes

Track footfall in movie theatres by screen, show slot, and release week. Benchmark your properties against every competing multiplex in the catchment, and spot the pincodes driving repeat visitors versus one-time walk-ins.

footfall in movie theatrestheatres datafoot traffic data in theatres

Theme Parks

See where visitors queue, wander, and drop off across zones. Theme park visitor analytics from MapZot.AI shows peak-hour crowding by ride cluster, average dwell time, and how weather and school-holiday calendars move your gate numbers.

theme park visitor analyticsvisitor behaviour analytics

Water Parks

Water park analytics that surface seasonal demand curves, weekday-versus-weekend crowd shifts, and the radius your park actually pulls from — so pricing and staffing can be planned around real, not assumed, attendance.

water park analyticsvenue traffic analytics

Zoos & Aquariums

Zoo visitor analytics and aquarium analytics that map family versus school-group visitation, ticket-counter queuing, and which enclosures or tanks draw the longest dwell — useful for everything from signage to exhibit investment.

zoo visitor analyticsaquarium analytics

Stadiums & Arenas

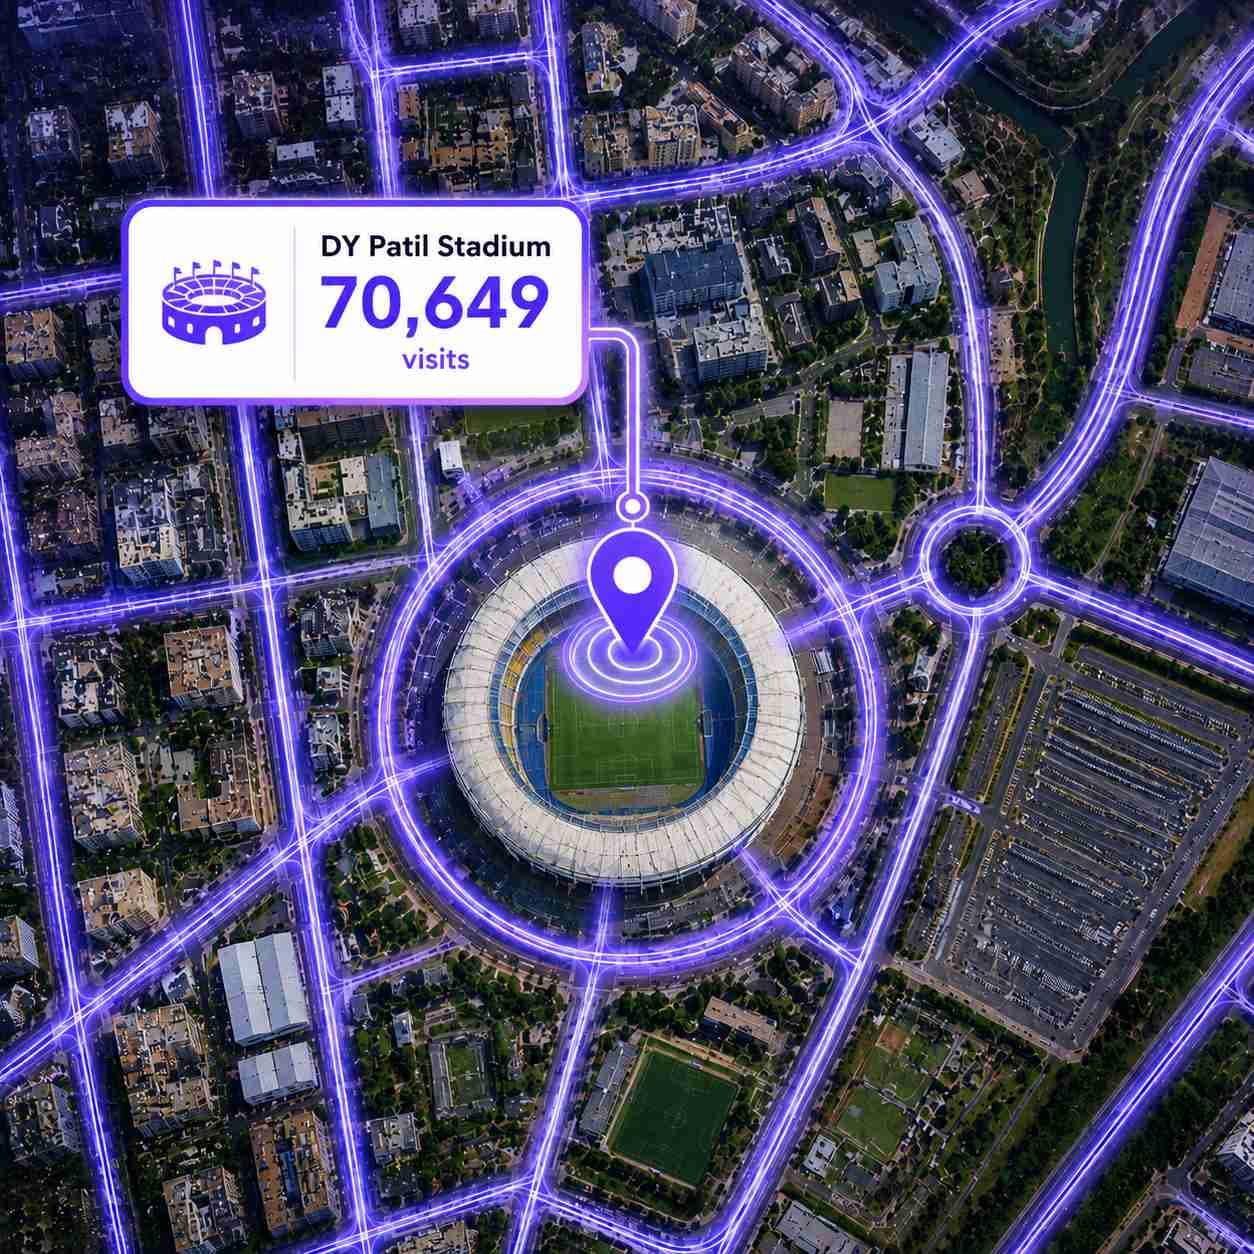
Stadium analytics and arena analytics for match-day and non-match-day traffic — gate-wise entry flow, surrounding parking and transit pressure, and how far your fan base genuinely travels for a fixture.

stadium analyticsarena analytics

Concert & Event Venues

Concert venue analytics and event venue analytics that quantify concert foot traffic data before, during, and after showtime — including the halo effect on nearby hospitality, retail, and transport demand.

concert venue analyticsconcert foot traffic dataevent venue analytics

FAQs

Ticketing and POS systems only capture people after they've paid. Venue traffic analytics from MapZot.AI captures footfall before and around that moment too, everyone who entered your catchment, compared you to a competitor, or walked past without buying, giving you the full demand picture, not just the converted one.
We aggregate anonymised, privacy-compliant mobility signals and match them to individual theatre and multiplex boundaries. This gives you foot traffic data in theatres broken down by property, screen cluster, show slot, and day of week — refreshed roughly every 15 minutes.
Yes. MapZot.AI's cinema location intelligence platform includes anonymised, aggregated benchmarking against every comparable theatre in your catchment, so you can see how your footfall stacks up against nearby competitors on any given release week.
Yes. Zoo visitor analytics and aquarium analytics on MapZot.AI cover footfall by entry gate, family versus school-group visitation patterns, and dwell time by enclosure or exhibit zone — useful for signage, staffing, and exhibit investment decisions.

Recent Publications

See your distribution the way MapZot.AI sees it

Get a free coverage snapshot for one brand or territory — general trade, modern trade, or quick commerce — anywhere in India.