Consumer Insight, Mapped to Every Shelf and Street in India

MapZot.IN turns store-level location data, footfall and consumer behaviour into CPG analytics your category, sales and marketing teams can act on, from a metro flagship outlet to the next kirana store in tier‑3 India

Get a Free Demo
Advertising site selection

CPG industry trends we track for India

The CPG industry trends shaping India move faster than most planning cycles. MapZot.AI keeps your teams close to the signals that actually predict cpg industry growth, not just last quarter's dashboard.

DEMAND

Quick commerce & hyperlocal demand

10–30 minute delivery is rewriting assortment and pack strategy street-by-street. We track dark store density against real footfall to show where demand is genuinely shifting.

GROWTH

Tier-2/3 & rural expansion

Much of India's cpg industry growth now sits outside metro cores. Our market analysis tools flag underserved pin codes before competitors do.

CHANNEL

General trade meets D2C

Kirana stores, modern trade and D2C now overlap for the same shopper. We map channel mix by micro-market so trade marketing spend follows the actual basket.

PRICING

Pack-size & price sensitivity

Inflation cycles push shoppers between SKUs and pack sizes. Consumer data analytics from MapZot.AI shows which price points hold volume in which geography.

CPG analytics built for how India actually shops

We combine geospatial data, point-of-sale signals and consumer surveys into a single layer of data analytics for business teams — so cpg analysis stops living in five different spreadsheets.

  • ✓Store-level footfall and store traffic data updated continuously across formats
  • ✓Shelf, assortment and out-of-stock intelligence by outlet cluster
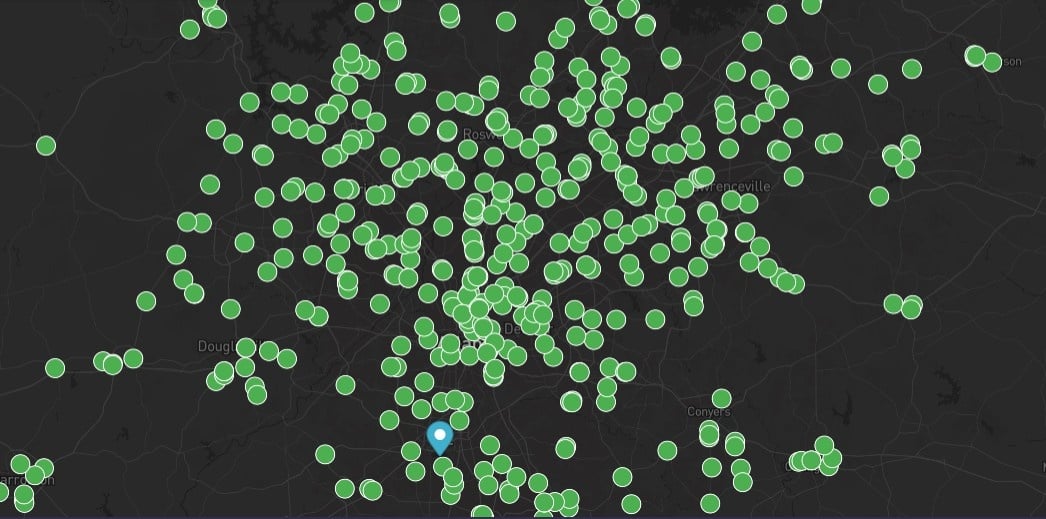
  • ✓Competitive market mapping down to the street and micro-market
  • ✓Demand forecasting powered by ai and data analysis, not gut-feel

Visits

?

D Mart

Plot no. 1, New Rohtak Rd, opp. Changujee chikkers, Siddipura, Karol Bagh, New Delhi, Delhi, 110005

How it comes together

One pipeline turns scattered signals into decisions your regional and national teams can actually use.

Capture

Geospatial + POS + survey data

We pull in store traffic data, transaction feeds and consumer research across formats and geographies, cleaned and standardised.

Analyse

AI and data analysis engine

Our models run cpg analysis against demand, distribution and pricing patterns to surface what's actually moving the category.

Act

Dashboards, alerts & APIs

Insights land where your teams already work — dashboards for category leads, APIs for data teams, alerts for the field.

FAQs

CPG analytics is the practice of turning store, shopper and market signals into decisions — what to stock, where to distribute, and how to price. MapZot.AI blends geospatial data, store traffic data, POS feeds and consumer surveys into one layer of data analytics for business teams, so cpg analysis isn't scattered across five different tools.
We continuously monitor store traffic data, channel mix and demand patterns across metro, tier-2 and tier-3 India, from quick commerce dark stores to general trade outlets. That gives category and marketing teams an early read on cpg industry trends and cpg industry growth, instead of relying on quarterly reports.
You can run both primary research (surveys, in-field consumer studies) and secondary market analysis through the same dashboard. Our customer research tools are built specifically for CPG questions, pack-size preference, price sensitivity, category switching and distribution gaps so cpg market research doesn't need a separate agency engagement.
MapZot.AI combines real footfall signals with modelled estimates where direct data isn't available, and is transparent about which is which. Store traffic data is refreshed continuously by format, city tier and daypart, so field and trade teams are working off current conditions, not last quarter's numbers.

Recent Publications

See what CPG analytics can do for your brand in India

Bring your next launch, distribution plan or trade budget — we'll show you the market analysis tools live on your own categories.