Site Selection Consulting for Real Estate Brokers Who Back Every Recommendation With Data

MapZot.AI turns labor market analysis, foot traffic, demographics and competitor density into a single real estate site selection score, so your brokerage can close faster, defend valuations, and win larger mandates.

Get a Free Demo
0+
Indian Cities Mapped
0+
Data Layers Per Site
0x
Faster Site Shortlisting
Site Score · Whitefield, Bengaluru87 / 100

Most real estate broker cost estimates are still built on intuition

Client mandates now demand more than a good relationship and a spreadsheet of comparable prices. Brokerage firms that still rely on manual footfall counts and word-of-mouth market reads lose mandates to teams who can show the numbers.

GAP / 01

Slow, manual market analysis

Assembling a real estate market analysis from census data, RERA filings and local surveys can take weeks — by which time the site may already be gone.

GAP / 02

No defensible number for clients

When a client asks “why this location,” brokers need more than a hunch. Without data-driven real estate scoring, recommendations are hard to defend under scrutiny.

GAP / 03

Expansion decisions made blind

Retail and QSR clients planning real estate expansion need labor market analysis, catchment income and competitor mapping — data most brokerage firms don't have in-house.

One dashboard for every real estate site selection call

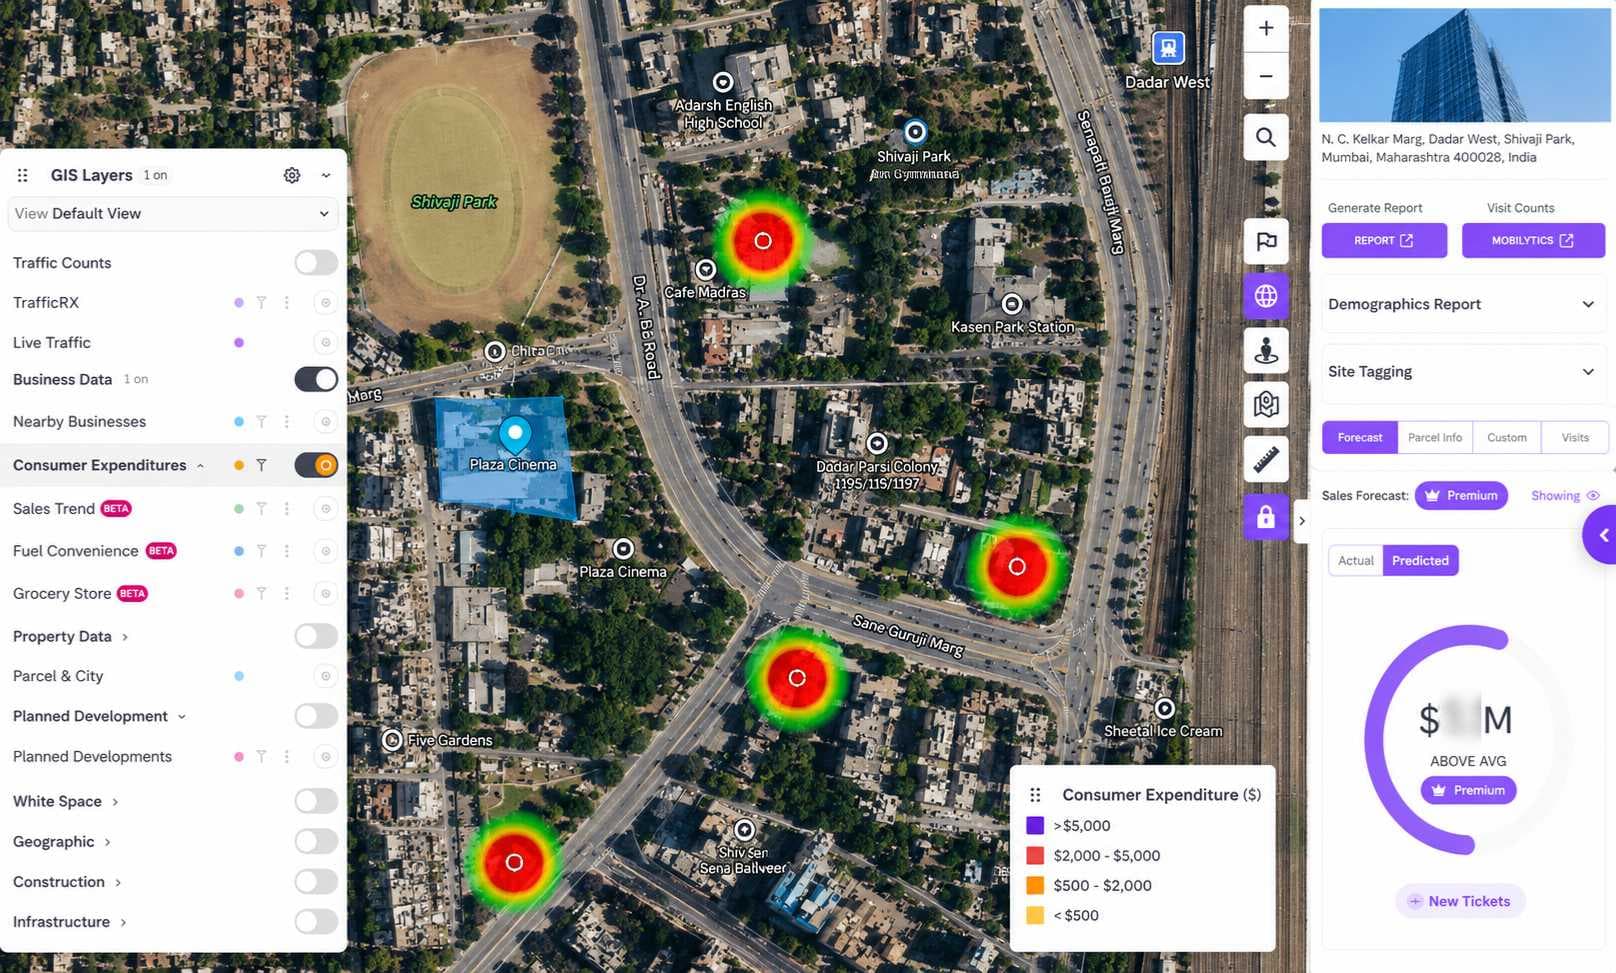
MapZot.AI is the AI for real estate layer that sits on top of your CRM and listings — pulling labor market analysis, demand heatmaps and cost benchmarks into one workspace your whole team can use.

MapZot.AI real estate site selection dashboard

From client brief to signed lease

01

Define the mandate

Set client criteria — category, budget, target catchment and expansion timeline.

02

Generate the shortlist

MapZot.AI ranks available real estate sites against 120+ data points instantly.

03

Present with data

Export a branded market analysis report the client can circulate internally.

04

Track and close

Monitor site performance post-recommendation and feed outcomes back into future pitches.

See growth in real estate before your competitors do

Compare micro-markets side by side on the metrics that actually move a client's decision — not just asking rent, but demand trajectory, labor supply and category saturation.

  • Real estate market insights refreshed monthly from public and licensed data sources.
  • Filter by category — retail, office, warehousing, F&B — for location real estate that fits the tenant.
  • Flag best sites for real estate expansion automatically, ranked by projected footfall and cost efficiency.
market-analysis / micro-market compare
Micro-marketDemand TrendCost / Sq.Ft.Site Score
Koramangala, Bengaluru▲Rising₹16591
Andheri West, Mumbai▲Rising₹21088
Hitec City, Hyderabad—Stable₹12876
Sector 62, Noida▲Rising₹9884
Kothrud, Pune—Stable₹11271
High confidence, verified dataEmerging market, limited history

Real estate services built for how you're measured

0.0×

Faster shortlisting

Cut real estate site selection time from weeks to hours with automated scoring.

+0%

Larger mandates won

Realtor brokers using data-backed pitches report stronger conversion on multi-site deals.

0+

Data layers per site

From labor market analysis to footfall — everything in one exportable real estate data sheet.

0

Cities covered in India

Tier 1 and Tier 2 coverage, growing monthly as your real estate in business expands.

FAQs

MapZot.AI scores every candidate location on footfall, accessibility, catchment income, competitor density and cost — giving your team a ranked, defensible shortlist for any real estate site selection mandate, from a single outlet to a multi-city rollout.
Yes. The Labor Market module surfaces workforce density, wage bands and commute-time coverage around any shortlisted site, so clients evaluating real estate expansion can see workforce availability alongside the property data.
MapZot.AI benchmarks lease rates, cost per square foot and comparable transactions by micro-market, helping you validate pricing and real estate broker cost expectations before you present them to a client.
Yes — coverage spans 28+ Indian cities across Tier 1 and Tier 2 markets, with data sourced and structured for how real estate brokers in India workflows actually operate, from RERA-linked filings to local demand signals.
Both. Independent realtor brokers use the platform for individual site pitches, while franchise networks and commercial leasing teams use it across multi-city, multi-analyst workflows with shared reporting.

Recent Publications

Bring data-driven real estate to your next client pitch

See a live walkthrough of the Brokerage Firms dashboard, mapped to a market you actually work in.